The Civic Dashboard: Making Public Projects Transparent and Trustworthy
Cities and nonprofits can raise trust when they publish easy to read project dashboards that show real time progress, spending, sustainability metrics, and community sentiment. This guide explains how a Civic Dashboard on FolioProjects turns open data and field updates into a single place the public can understand.
What is a Civic Dashboard
A Civic Dashboard is a public page that shows the status of projects in plain language. It highlights schedule, budget, milestones, detours, permits, and community sentiment. When done well, residents can scan a QR code on a sign at the work site and land on a page that answers the question everyone has in mind. What is happening here, why, for how long, and who do I contact if there is a problem.
FolioProjects provides a public facing dashboard that is linked to the same workspace your internal team uses for planning and reporting. The result is less duplicate work for staff and more clarity for the community.
Why transparency matters
- Trust: Show progress and reasoning so stakeholders feel included.
- Accountability: Publish spend to date, schedule variance, and change history.
- Participation: Invite sentiment, questions, and ideas in a respectful way.
- Fewer complaints: When citizens have facts, service calls drop and support rises.
If your organization receives grants or reports on sustainability, a Civic Dashboard helps you meet disclosure goals while improving everyday communication with residents and partners.
How FolioProjects powers a Civic Dashboard
FolioProjects brings planning, field updates, analytics, and public communication into one platform. Here are core features that align with civic needs.
- Dashboards and analytics: See live summaries across portfolios and projects. Learn more in the Dashboards and Analytics guides.
- HueFlux community sentiment: Capture resident feedback with a simple color scale that updates in real time. See the HueFlux page and this public works explainer on stakeholder voting.
- QR codes in the field: Put a QR code on detour signs and work notices so visitors reach project details instantly. See QR codes for public works dashboards and detour communication.
- Project health with EVM: Show cost and schedule status with earned value metrics such as CPI and SPI in the Project Health doc.
- Notifications and alerts: Automate updates to staff and the public when milestones change. See Notifications.
- Search and open access: Make it easy for the public to find projects by keyword and location. See Search.
- Projects and portfolios: Organize work into projects and roll them up into portfolios for an at a glance view. See Projects.
- Security: Keep sensitive data private while sharing only approved fields on public pages. See Security.
What to publish on your dashboard
The goal is clarity without jargon. Publish the smallest set of information that answers common questions while meeting transparency goals.
| Content | Why it matters | Suggested update rhythm |
|---|---|---|
| Plain language summary | Explains purpose, expected benefits, and who is responsible | At kickoff and when scope changes |
| Start and completion windows | Sets expectations for residents and nearby businesses | Real time with schedule changes |
| Map, detours, and closures | Reduces frustration and safety risks | Whenever traffic control changes |
| Budget and spend to date | Builds confidence that funds are used wisely | Monthly or at major milestones |
| Key milestones | Shows tangible progress and helps media coverage | Real time when achieved |
| Community sentiment score | Signals issues early and celebrates support | Real time from QR interactions |
| Contact and feedback | Offers a respectful path to be heard | Always available |
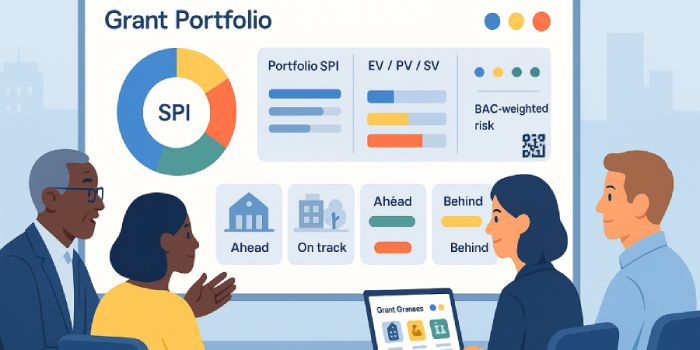
To see how a grant program can present portfolio results, read Grant Portfolio Dashboards. For a deeper overview of dashboard design, see Understanding the Dashboard.
Privacy and security basics
A Civic Dashboard should never reveal personal information, internal notes, or sensitive contracts. FolioProjects supports role based access so public pages only include approved fields. You control what is visible by default and what remains for staff only. Review your practices with the Security guide.
A simple ninety day implementation plan
- Days 1 to 15: Pick three pilots such as a road resurfacing, a park upgrade, and a facility retrofit. Create each project in FolioProjects and set the public fields. Add QR codes to site signs.
- Days 16 to 45: Publish milestones, budget ranges, maps, and traffic changes. Turn on notifications for detour updates and service outages. Invite a small group of residents to test.
- Days 46 to 90: Expand to a small portfolio and feature it on your site header. Use earned value to summarize health. Share monthly highlights on your blog and prepare a case study for council.
If your team tracks sustainability metrics or climate actions, align the new dashboard with ESG and portfolio management and the stakeholder engagement guide.
Civic use cases that benefit today
Public works
Use QR codes on roadwork and utility notices to route people to current detour details and timelines. Start with the QR code primer for public works and the deeper dive on detour communication.
Housing and community projects
Show construction phases, compliance checkpoints, noise windows, and community benefits. Invite residents to share sentiment through HueFlux so risks are caught early. See engagement for housing and community projects.
Nonprofit and grant funded work
Many programs must report outcomes, equity goals, and financial stewardship. A Civic Dashboard can publish rollups by portfolio so funders and the public see proof of results. Learn more in nonprofit engagement and grant portfolio dashboards.
Success metrics that build trust
- Schedule performance: SPI from earned value and milestone hit rate.
- Cost performance: CPI and variance at completion.
- Service impact: Number of detour days and unplanned outages.
- Engagement quality: HueFlux positive to negative ratio and response time to concerns.
- Reach: QR scans, unique visitors, and repeat visits to the dashboard.
These signals can be displayed on portfolio pages so leaders and the public see the same picture. Review the Project Health reference for definitions.
Frequently asked questions
Get started
You can try a Civic Dashboard with a small pilot and expand once leaders see the benefits. Explore the demos, review pricing, and contact our team through the contact page. If you want to learn more about FolioProjects in general, visit the homepage and browse the documentation.