How Nonprofits Can Turn Engagement Data into Grant Dollar
Nonprofits often struggle to prove their impact to funders. Engagement data offers a clear, measurable way to demonstrate reach, accountability, and community trust. This article explains how organizations can transform participation metrics into stronger grant applications with the help of FolioProjects.
Why engagement data matters
Grantmakers increasingly require proof that projects not only launched but also delivered real outcomes. Engagement data answers questions such as: How many people participated? Was sentiment positive or negative? Did the project reach underserved groups? These signals help funders see that every donated dollar creates measurable value.
Types of engagement data nonprofits can track
- Event attendance: Who joined workshops, panels, or community events.
- QR code scans: How many people engaged with signage or materials.
- Sentiment scores: Captured through HueFlux color responses for quick insight into supporter mood.
- Online engagement: Comments, shares, and survey responses across digital platforms.
- Volunteer hours: Time donated and tasks completed by community members.
These data points can be exported from FolioProjects dashboards and presented in grant applications as proof of active, measurable engagement.
How FolioProjects helps nonprofits
FolioProjects simplifies the process of capturing, analyzing, and sharing engagement data. Features designed for nonprofits include:
- Portfolios: Group projects under one grant umbrella and see rollups. Learn more on the Portfolios page.
- Analytics: Visualize key metrics such as sentiment breakdowns and QR scans. See Analytics.
- HueFlux sentiment: A visual feedback system for funders and the public. Read more about HueFlux.
- Dashboards: Publish transparent updates that supporters and funders can access at any time. See Dashboards.
Aligning engagement data with grant requirements
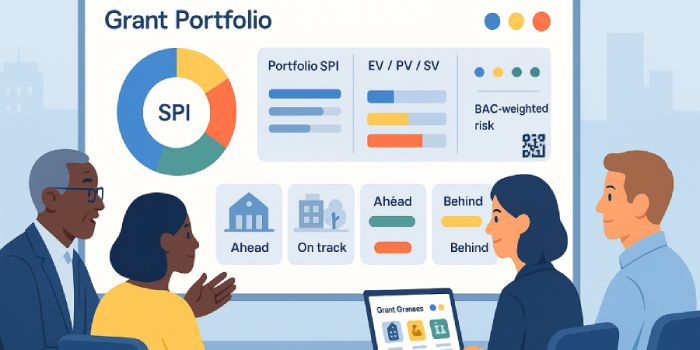
Most grants request evidence in categories such as outreach, equity, inclusion, and sustainability. By tagging data in FolioProjects with these categories, nonprofits can map real participation metrics to the funder’s exact reporting framework. This reduces guesswork and strengthens compliance.
See our guide on Grant Portfolio Dashboards for practical examples.
Turning metrics into stories funders believe
Numbers alone rarely inspire. Successful applications pair data with stories. For example:
- “Over 1,200 residents scanned QR codes to learn about our climate program.”
- “Sentiment improved from red to blue after we added more multilingual volunteers.”
- “Volunteer hours doubled, reducing project costs and increasing community ownership.”
FolioProjects dashboards give nonprofits a library of charts and narratives to reuse in reports and applications.
A ninety day data-to-grants plan
- Days 1 to 15: Select two pilot projects and configure FolioProjects to capture QR scans, HueFlux sentiment, and volunteer hours.
- Days 16 to 45: Begin reporting in dashboards. Export analytics weekly and tag outcomes to grant categories.
- Days 46 to 90: Build a grant application that weaves stories around the captured data. Share dashboards with funders as live proof of outcomes.
Common challenges and how to solve them
- Data gaps: Use QR codes and sentiment prompts in more locations to capture wider reach.
- Staff time: Automate updates with FolioProjects notifications and scheduled reports.
- Privacy: Share aggregate stats only. See the Security guide.
Frequently asked questions
Get started
Turning engagement into dollars is no longer guesswork. With FolioProjects, nonprofits can capture data, publish dashboards, and build stronger applications. Explore our demos, review pricing, and reach us on the contact page.