Detour Communication Playbook: Using QR Codes + Live Dashboards for Street Projects
Reduce confusion and angry calls during roadworks. This playbook shows how to pair QR codes with a live public works dashboard—including schedule health (SPI, EV, PV, SV) and stakeholder voting via HueFlux)—so residents get real-time answers from the job site.
The Detour Communication Problem
Street projects move fast. Signs go up, routes shift, and residents want answers now. Traditional tactics—paper flyers, PDF notices, quarterly updates—lag the work by days or weeks. The result: complaint spikes, misinformation on social media, and frustrated staff time spent repeating the same information.
What residents need is a single, trusted source that updates as the project does. That’s where QR codes pointing to a live, mobile-friendly public works dashboard are game-changing.
Why QR Codes + Live Dashboards Work
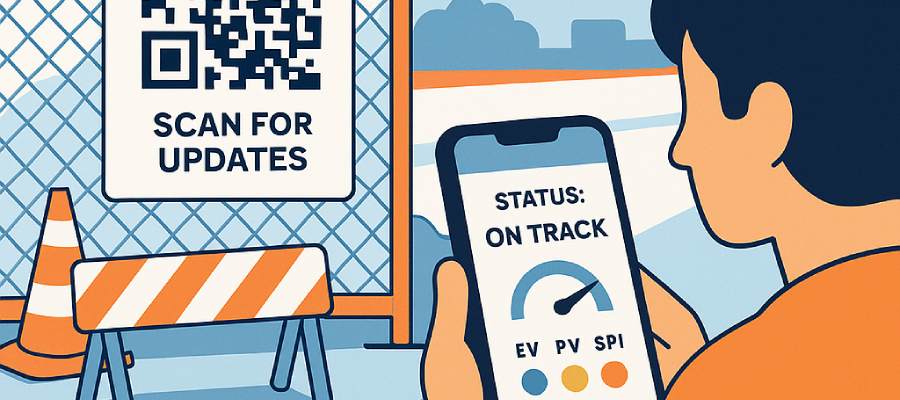
- Instant discovery: a passerby scans a fence sign and lands on today’s status—not a stale PDF.
- Schedule truth: the dashboard shows schedule EVM—SPI (EV÷PV), EV, PV, SV—with a plain label: Ahead, On track, or Behind.
- Two-way signal: quick stakeholder voting via HueFlux captures sentiment (internal and external) without spinning up a survey.
- One source, many surfaces: the same live page can be embedded on the city website, shared in council packets, and linked from emails.
What Your Public Works Dashboard Should Show
FolioProjects’ “At-a-Glance” view surfaces the essentials residents understand and staff can stand behind:
- Schedule EVM (EV, PV, SPI, SV): along with a color/status label. Learn the model in Project Health — EVM (Schedule).
- HueFlux stakeholder voting: intuitive colors for sentiment (blue/yellow positive, red negative, natural blends). See municipal context in Public Works Dashboards with Stakeholder Voting (HueFlux).
- Useful links: detour maps, permits, council memos, meeting recordings.
- Timeline highlights: start/end dates, “due in X days,” milestone completion.
Good UX rule: empty fields are hidden—no wall of “TBD.” As data arrives, the row appears automatically.
QR Signage Strategy: Placement, Design, Accessibility
Placement
- Fence banners & kiosks: eye-level (4–6 ft), at both ends of the work zone and near pedestrian decision points.
- Door hangers & mailers: for adjacent blocks prior to noisy or night work.
- Council/committee packets: include the same code that resolves to the live page.
Design
- Short URL printed beneath the code (fallback when cameras struggle).
- High contrast (dark code on white), quiet zone ≥ 4 modules, and minimum size ≈ 30 mm (1.2 in) for 3–4 ft scans.
- Message clarity: “Scan for live project updates” with language badges (EN/ES/…).
Accessibility & Safety
- Pair color with text on the dashboard (e.g., Ahead/On/Behind alongside any color cues).
- Ensure mobile layout is legible on small screens (360–414 px).
- Place signs so scans don’t require crossing traffic or walking into the roadway.
Measurement
- Append UTM tags (e.g.,
?utm_source=fence_a&utm_medium=sign&utm_campaign=streets_2025) to distinguish each sign. - Track visits, scans, link clicks, and HueFlux voting patterns to see what messaging works.
Step-by-Step: Implementing in FolioProjects
- Create a portfolio for your Capital Improvement Program; add a project per site or workstream.
- Set schedule fields (start, end, milestones) on each project so EV, PV, SV, and SPI can compute. See Project Health — EVM (Schedule).
- Enable stakeholder voting with HueFlux; optionally increase internal weighting for engineers/PMs.
- Publish a public view (dashboard only or additional tabs) and, if desired, embed it on your city website.
- Generate a QR code to the dashboard URL. Add UTM tags for each sign. (If you haven’t yet, read: QR Codes for Public Works Dashboards — Real-Time Job-Site Updates.)
- Print signage (banners, door hangers) and deploy at agreed locations.
- Monitor Analytics weekly; post a short update every 1–2 weeks—even “no change” improves trust.
Example embed (optional):
<iframe src="https://folioprojects.com/p/your-project?public=1" title="Public Works Dashboard" width="100%" height="680" style="border:0;max-width:1200px;" loading="lazy" referrerpolicy="strict-origin-when-cross-origin"></iframe>Governance, Privacy, and Data Freshness
- Public vs. member-only: expose the overview and detour info publicly; keep sensitive artifacts private. Adjust anytime.
- Schedule-only EVM: FolioProjects publishes EV, PV, SPI, SV; CPI is excluded unless Actual Cost is provided from finance systems.
- Moderation: HueFlux is a controlled, lightweight signal (not free-text). Rate-limit and review anomalies in Analytics.
- Freshness policy: align your update cadence (e.g., weekly) and note it on the page (“Updated every Friday”). Residents value predictability more than perfection.
Mini Case Example
Streetscape Phase 2 (Downtown). The team launched a QR-powered dashboard at Notice to Proceed. Over six weeks, a detour change triggered a spike in red sentiment captured via HueFlux. With clearer signage and a revised route, sentiment normalized within two updates and SPI moved from 0.89 (behind) to 1.02 (on track). Calls to the hotline dropped by 37%.
Quick Checklist
- Create portfolio and projects; set start/end and milestones.
- Enable HueFlux voting; set internal/external weights.
- Publish public dashboard; embed on the city website (optional).
- Generate unique QR codes with UTM tags for each sign.
- Place signs at both ends of the work zone and at pedestrian decision points.
- Post weekly updates; review Analytics and sentiment trends.
FAQ
How do we prevent spam voting or brigading?
Use HueFlux with internal/external weighting, basic rate limits, and Analytics review. Because HueFlux captures a quick signal (not free-text), anomalies are easy to spot and explain publicly.
Do we need to show costs or CPI?
No. This playbook focuses on schedule EVM—EV, PV, SPI, SV—which is easy for residents to grasp. Link to separate financial dashboards if required.
What if cell service is poor at the site?
Print the short URL under the code so residents can visit later. Keep the first screen lightweight (no heavy media), and consider caching detour maps on a CDN.
Any tips for multilingual neighborhoods?
Include bilingual copy on the sign and set your dashboard to auto-detect locale where possible. Keep labels like Ahead/On/Behind short and paired with color.
Keywords used naturally: detour communication, QR codes, public works dashboard, municipal project dashboard, stakeholder voting, HueFlux, SPI, EV, PV, SV, transparency, civic engagement.