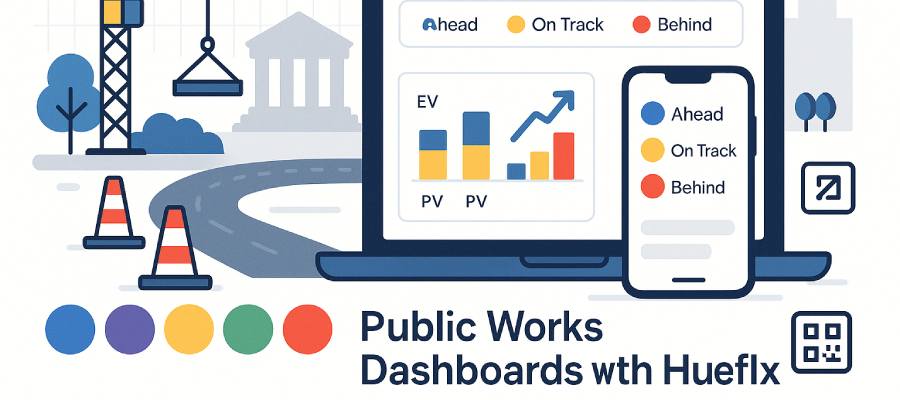
Public Works Dashboards with Stakeholder Voting (HueFlux)
Build transparent, shareable, and data-driven municipal project pages that combine schedule health with real-time community sentiment.
What is a Public Works Dashboard?
A public works dashboard is a live, web-based view of capital projects—street repairs, parks upgrades, transit improvements—designed for rapid understanding by residents, councilmembers, and project teams. In FolioProjects, each project (and portfolio) exposes a concise, actionable “At-a-Glance” view that highlights schedule performance (EV, PV, SPI, SV) and essential context like risks, links, and engagement.
Unlike static PDFs or quarterly slides, a municipal project dashboard is continuously updated, can be embedded on city websites, and can be shared with QR codes posted on-site so nearby residents can follow along and provide input.
Why Stakeholder Voting (HueFlux) Matters
Stakeholder voting turns passive status pages into active civic feedback loops. FolioProjects uses HueFlux—a colored-symbol sentiment system—to capture internal and external signals: blue (internal positive), yellow (external positive), and red (negative), with natural blends (green/orange/purple) that communicate mixed sentiment at a glance. You can optionally weight internal participants (e.g., city engineers) versus external participants (e.g., residents) to reduce brigading and keep decision-making grounded.
The result is a single pane showing both project portfolio management signals and community sentiment—no juggling survey embeds, spreadsheets, and email threads.
Key Benefits for Public Agencies
- Transparency & trust: share real-time status with residents and council using embeds and QR codes.
- Schedule truth: “At-a-Glance” EVM (Schedule) shows Ahead / On track / Behind via **SPI** (EV÷PV), with EV/PV/SV on hover.
- Actionable feedback: HueFlux consolidates sentiment without a heavy survey process; signal is visible to non-technical audiences.
- Frictionless sharing: publish dashboards via embeds/iframes and QR signage at job sites.
- Lightweight operations: no enterprise PPM overhead—just the fields you need to keep projects moving.
How FolioProjects Enables This
- Projects & Portfolios: model individual jobs and city-wide programs; roll up status for councils and the public.
- At-a-Glance (EVM—Schedule): EV, PV, SPI (status), and SV—cleanly explained with tooltips.
- HueFlux voting: internal vs. external signals with clear color semantics; adjustable weighting.
- Sharing & Embeds: place dashboards directly on municipal sites; control what is public vs. private.
- QR Codes: print signage to let residents jump to the latest status from the sidewalk.
- Analytics: track visits, link clicks, and engagement patterns.
- Privacy model: set pages to public, member-only, or mixed (public overview, private details).
Implementation Guide (Step-by-Step)
- Create a portfolio for your Capital Improvement Program (CIP) and add child projects for each site or workstream. See Portfolios.
- Set schedule fields on each project: start date, end date, milestones (counts). This powers EV, PV, SPI, and SV. See EVM (Schedule).
- Enable HueFlux stakeholder voting; (optionally) adjust internal/external weighting to fit your engagement policy. See HueFlux.
- Attach links to permits, council memos, design docs, and public meeting recordings; clicks roll up in Analytics.
- Publish a public dashboard via embed and place QR codes on site fencing and mailers.
- Review the portfolio view weekly: portfolio SPI (ΣEV/ΣPV), risk counts, and HueFlux trend give a fast cross-program read.
- Iterate with feedback: fold resident sentiment and comments into risk/communications plans; update milestones to keep EV honest.
KPIs & Metrics to Track
- SPI (Schedule Performance Index): ≥1.05 Ahead, 0.95–1.05 On, <0.95 Behind.
- SV (Schedule Variance): EV−PV; positive is ahead of plan.
- HueFlux ratio: external (yellow) vs. internal (blue) positive signals; watch for rising red.
- Risk count & severity: track new risks and changes after community meetings.
- Engagement: visitors, votes, and link clicks (agenda packets, design PDFs).
Governance, Privacy & Accessibility
- Privacy controls: keep sensitive details member-only while exposing a public overview. See Privacy model.
- Data provenance: dashboards show schedule health derived from EV/PV; FolioProjects intentionally excludes CPI unless Actual Cost is provided by your systems.
- Accessibility: use clear color+text labels (Ahead/On/Behind), alt text on images, and readable link text; QR codes should land on mobile-friendly pages.
FAQ
How is HueFlux different from a survey?
Surveys collect long-form responses; HueFlux is a lightweight voting signal that residents can submit quickly from phones or QR signage. It’s designed to complement—not replace—formal engagement.
Can we prevent brigading?
Yes. Weight internal vs. external votes, throttle repeats, and review analytics for anomalies. HueFlux is transparent and easily audited.
Do we show CPI or costs?
By default, FolioProjects focuses on schedule EVM (EV, PV, SPI, SV) for clarity. If you maintain Actual Cost elsewhere, you can reference it in linked docs and dashboards.
Can we embed this on our city website?
Yes—use embeds/iframes and QR codes to publish and distribute the same live dashboard.
Get Started
Create your portfolio, add a pilot project, and publish a public works dashboard with stakeholder voting in under an hour. Start with Projects, wire up At-a-Glance (EVM—Schedule), enable HueFlux, and share via embeds and QR codes.