QR Codes for Public Works Dashboards — Real-Time Updates from the Job Site

QR Codes for Public Works Dashboards — Real-Time Job-Site Updates
By FolioProjects · · 7–9 min read
Turn construction fences and mailers into live status portals. Use QR codes to connect residents to a public works dashboard that shows schedule EVM (SPI, EV, PV, SV) and HueFlux stakeholder voting—with embeds, privacy controls, and Analytics.
Why QR for Public Works Dashboards
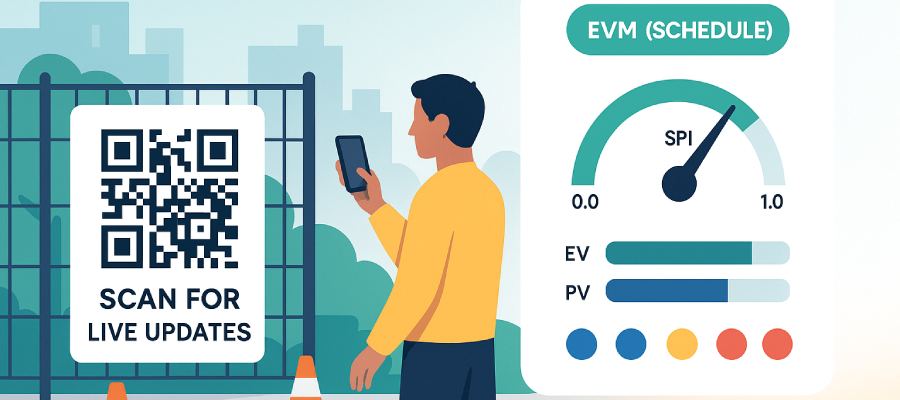
QR codes make your municipal project dashboard discoverable the moment a resident walks by the job site. Scanning lands them on a mobile-friendly page that reflects today’s status—no more out-of-date PDFs.
- Transparency & trust: live information beats static flyers.
- Two-way signal: quick HueFlux votes capture sentiment without heavy survey tooling.
- Low friction: no apps required; public pages respect your privacy settings.
What the Dashboard Shows (EVM + HueFlux)
FolioProjects “At-a-Glance” surfaces schedule EVM—EV, PV, SPI (EV÷PV), SV—and a plain-English status: Ahead, On track, or Behind. Deep dive: Project Health — EVM (Schedule).
Alongside schedule, HueFlux stakeholder voting blends internal (blue) and external (yellow) positives with red negatives for an at-a-glance sentiment signal. Context like links to permits/council memos and timeline rounds out the page. Items without data are hidden—no wall of “TBD”.
Municipal framing and examples: Public Works Dashboards with Stakeholder Voting (HueFlux).
QR Strategy: Placement, Design & Accessibility
Placement
- On-site signage: fence banners, kiosks, and trailers at eye level (4–6 ft).
- Mailers & door hangers: notify adjacent blocks before noisy work.
- Council/committee packets: include the same code that resolves to the live dashboard.
Design
- Short URL under the code for fallback.
- High contrast, quiet zone ≥ 4 modules, size ≥ 30 mm (~1.2 in) for 3–4 ft scans.
- Language cue: “Scan for project updates” + locale badges (EN/ES/…).
Accessibility & Safety
- WCAG basics: combine color with text (“Ahead/On/Behind”), alt text, descriptive links.
- Mobile first: ensure cards stack cleanly on 360–414 px screens.
- Safe placement: avoid requiring street crossing to scan.
Measurement
- Append UTM tags (e.g.,
?utm_source=fence_a) to distinguish signs. - Track visits, scans, and HueFlux votes in Analytics.
Implementation Guide (Step-by-Step)
- Create a portfolio for your CIP and add a project per site/workstream. See Projects.
- Set schedule fields (start, end, milestones) so EV, PV, SPI, and SV compute. See Project Health — EVM (Schedule).
- Enable HueFlux voting; adjust internal vs external weighting if required by policy.
- Publish a public view (dashboard-only or full project) and, if desired, embed it on your city website.
- Generate a QR code to the dashboard URL (with UTM tags), then print banners and door hangers.
- Monitor Analytics weekly; fold insights into comms and detour signage updates.
Governance, Privacy & Data Policy
- Public vs member-only: keep sensitive artifacts private while exposing a public overview.
- Schedule-only EVM: FolioProjects shows EV, PV, SPI, SV; CPI requires Actual Cost.
- Moderation: HueFlux is a quick signal (not free-text). Rate-limit and review Analytics for anomalies.
- Provenance: link official PDFs (permits, memos) from the dashboard for records.
Mini Case Example
Streetscape Phase 2 (Downtown) launched a QR-powered dashboard at Notice to Proceed. Over six weeks, weekly updates kept SPI visible; a detour change triggered a spike in red sentiment captured via HueFlux. The team responded with improved routing and signage—sentiment normalized within two updates, and SPI moved from 0.89 (behind) to 1.02 (on track).
- What worked: fast resident access via QR; transparent feedback loop; simple status language.
- Improve next: larger code on the first banner; bilingual copy at the detour start.
FAQ
Keywords used naturally: QR codes, public works dashboards, municipal project dashboard, stakeholder voting, HueFlux, SPI, EV, PV, SV, transparency, civic engagement.